Chamber Pumpdown Studies
Benefits:
Residual gas analyzers are valuable tools for vacuum system maintenance and pumpdown studies. Many users limit their RGA uses to just leak detection after a problem has been discovered because the chamber does not meet base pressure specifications. The following studies show the value of vacuum chamber monitoring during the initial pumpdown after PM's.
The object of the studies was to find problems early in the pumpdown routine and correct them to decrease the total cycle time. Once certain problems were identified, the technicians could then be alerted with the new Process Eye alarm and warning screens. Since these alarms would be built in to the recipe, the technicians would not be required to have RGA analysis knowledge.
The first chamber in this series shows a normal pumpdown to an acceptable base pressure for the process to begin. The rest of the chambers all had some problem that caused longer pumpdown cycles or unacceptable final RGA scans. These chambers had to go through another cycle to reach acceptable levels.
Early warning of the chamber problems, and correction of them, could have saved the more than 150 hours of time in just these six systems. This was the time required to rerun the tests. This related to a loss of 150 hours of production time!
MKS Instruments/Spectra continues to work with their customers to develop new software and RGA hardware to be able to solve this type of problem in production and other vacuum process applications.
Experiment:
Develop a testing method for the bakeout and testing of vacuum chambers used in production. The object was to watch and monitor the chambers to learn about the pumpdown cycle. The second objective was to pinpoint items that could be changed to decrease the pumping time and improve the base vacuum levels. Data was collected throughout the pumpdown, bakeout and cooldown of the chambers.
Equipment:
The initial testing was done with a new Vision 1000 B package from SPECTRA. This includes a MicroVision control unit and a high sensitivity dual filter, open ion source analyzer. Data was collected with the RGA for Windows software package to determine parameters and conditions for future experiments. Later monitoring and control will be done with the Process Eye software and the built-in alarm and warning screens. Complete scans were taken from 1 to 100 and stored to disk for later RECALL in Bar Graph or Trend displays.
Results:
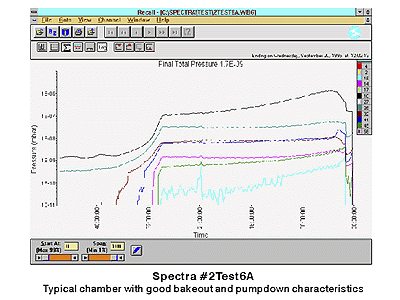
Spectra #2 Test 6A
Spectra #Test6A The basic chamber test consists of a 2 hour initial pumpdown and then a bakeout period of 30 plus hours with a final cooldown to base pressure. This system passed with no abnormalities.
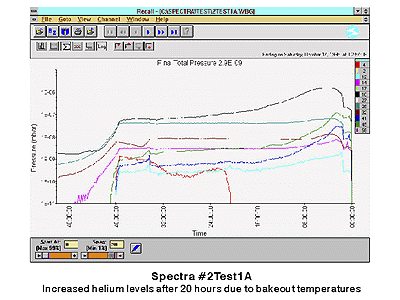
Spectra #2 Test 1A
Spectra #2Test1A This chamber showed a significant increase in helium after about 20 hours. This was traced to the bakeout heat starting to heat the cryopump and evolving the trapped gases. Cryopump regeneration after extensive leak checking and before bakeout will eliminate this problem.
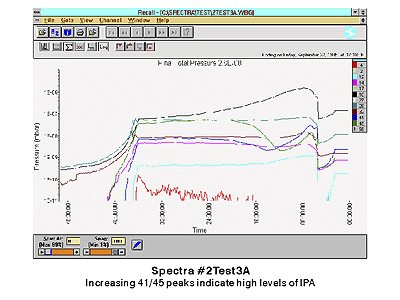
Spectra #2 Test 3A
Spectra #2Test3A After about 10 hours into the run masses 41/45 increased significantly in this chamber. This was due to isopropyl alcohol outgassing. Care in cleaning and a lighter use of IPA would have eliminated this problem. The levels were high enough to suggest that some liquid may have been trapped in a small hole or unvented screw hole. Production time was lost on this system since additional cleaning and bake was required before production could resume.
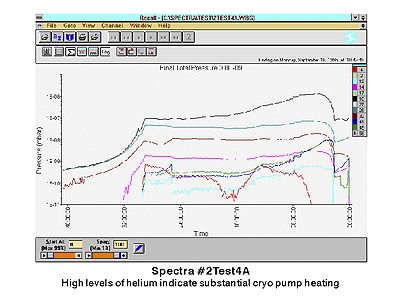
Spectra #2 Test 4A
Spectra #2Test4A This system showed a high helium level earlier in the bakeout cycle than most chambers. This was an indication of a hardware difference (no cryo heat shield) and excessive loads of helium during leak checking. Cryo regeneration and then another bakeout lost valuable production time.
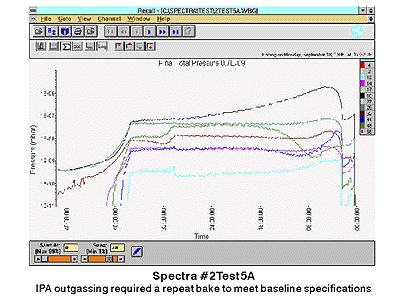
Spectra #2 Test 5A
Spectra #2Test5A This is another example of excessive use of IPA during PM peaks(41/45). The IPA did decrease when the chamber was cooled, however heat during deposition would have increased the peaks again to an unsatisfactory level.
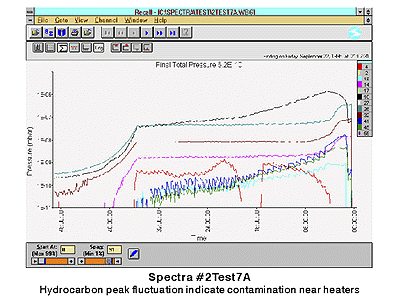
Spectra #2 Test 7A
Spectra #2Test7A Helium was high in this chamber and mysteriously disappeared, then reappeared. The bumps in the other trends show a direct interaction between heater cycles and chamber outgassing. This was an indication of a "dirty" heater or contaminants in close proximity to the heater. Higher fluctuations of the hydrocarbon peaks (12, 41, 45) indicate possible oil contamination.
 Ultra-High Velocity